Architecture Analysis
Current site: Single-page Vite + React 18 app. Page chrome is React; the interactive map is D3 over us-atlas TopoJSON. Deployed as a static site on GitHub Pages under the /measles-dashboard/ base path.
GitHub: https://github.com/ACCIDDA/measles-dashboard
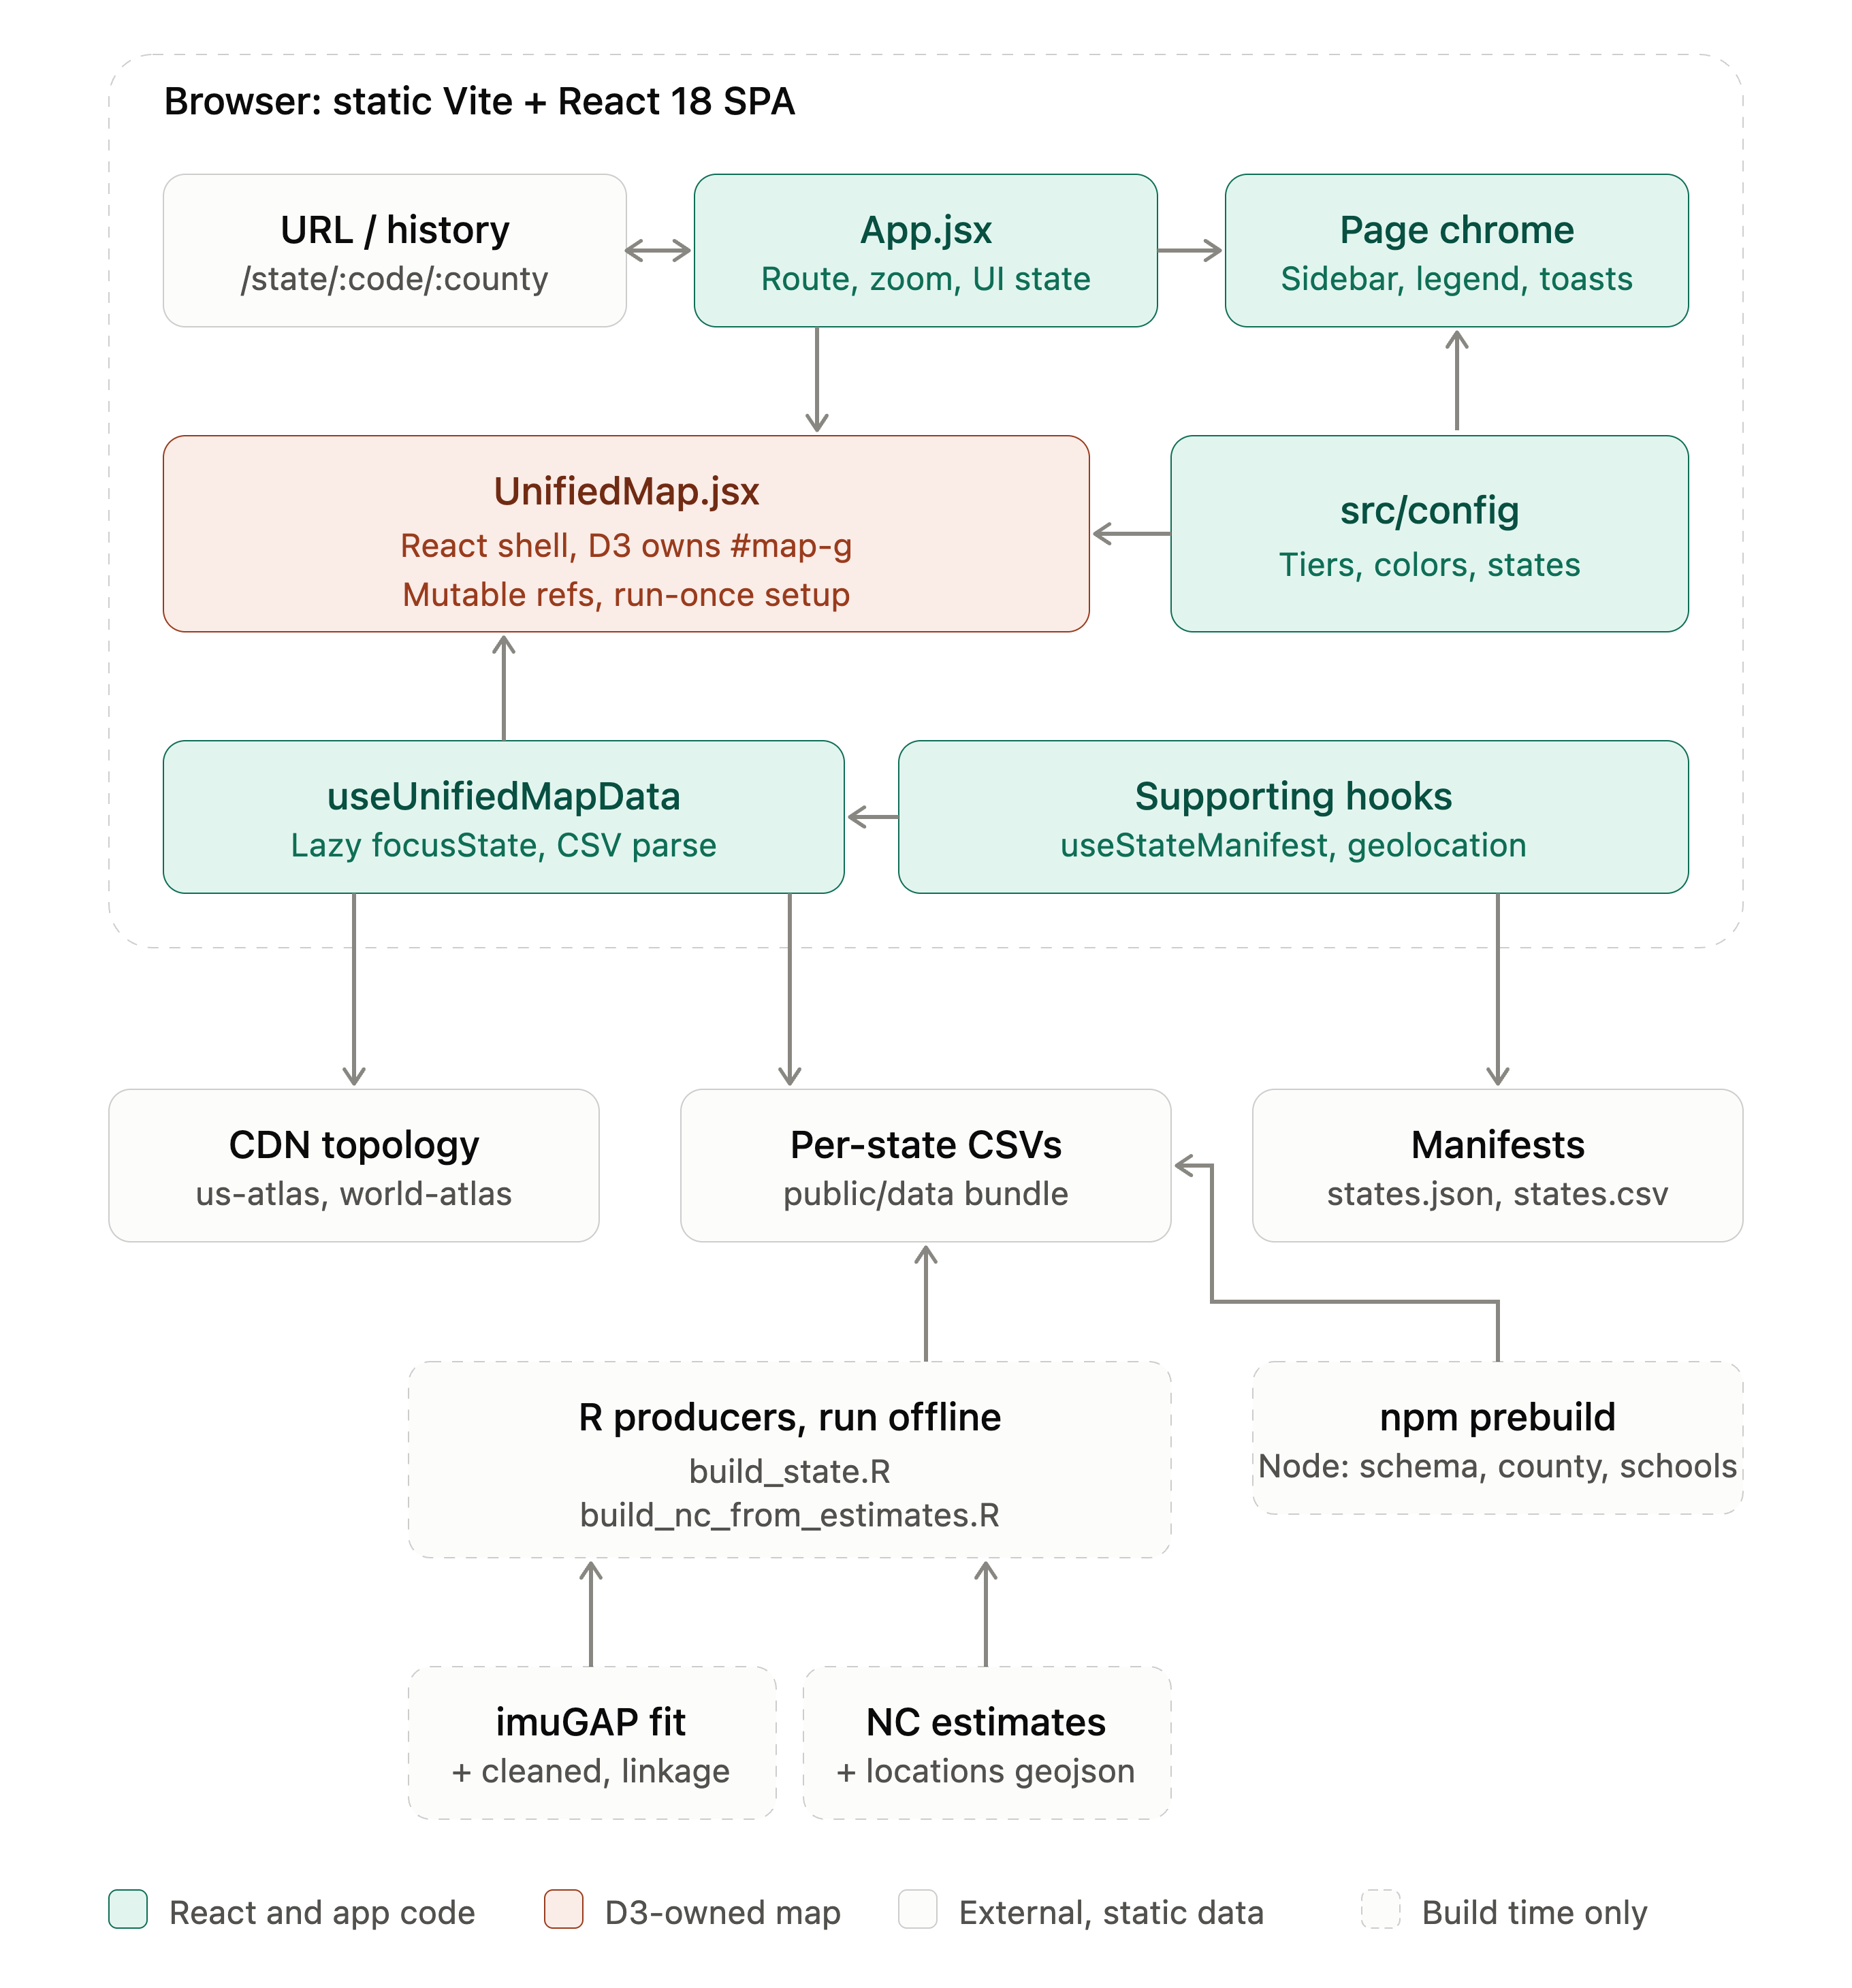
The dashboard is a static single-page app (Vite + React 18) with no backend. Its URL drives everything: App.jsx parses the route into a zoom level (national, state, county) and passes it, along with a small amount of UI state, to the page chrome and the map.
UnifiedMap.jsx is the one place React and D3 meet. React renders the SVG shell and D3 owns everything inside #map-g, using mutable refs so the setup effect runs once. Colors and thresholds come from src/config. useUnifiedMapData loads shared topology and manifests once, then lazy-loads each state's CSVs on demand and caches them. Geography comes from a CDN, and all other data comes from static files served alongside the app.
The data behind those files is produced in two stages, both outside the running app:
- R producers (build_state.R for states with an imuGAP fit, build_nc_from_estimates.R for NC's pre-predicted estimates) write a shared CSV schema, and the results are committed under public/data/.
- On every build, an npm prebuild step generates download and API files from the committed schools.csv: per-county CSVs, all-schools.csv, schema.json (from the single-source src/data/schema.js) and the API docs page.
Notes
- Committed vs generated: The app loads only the committed state CSVs and schools.csv. Everything prebuild generates is for downloads and the data API, not for the app. Generating it at build time avoids committing 150+ derived files on every data change.
- Shared schema: Both R producers emit the same schema, which is why the loader treats every state identically. Adding a state is meant to be data plus config, not code.
- Ownership split: React owns the chrome and D3 owns the map interior. DOM ids like #map-g and #tooltip are load-bearing because D3 and the e2e tests select by them.
- Typed access for outside users: schema.json lets external consumers, for example R through Arrow, read the CSVs with guaranteed column types instead of inferring them.
Questions
- The R scripts are run offline and are not part of prebuild. This differs from what issue #20 originally planned.
- The architecture doc says the pipeline is "in flux" and will be updated after #20 lands. It seems like #20 is finished, so should the pipeline be updated as final?
- The R script headers still describe per-county files as producer output, but the county files are now derived by Node. The diagram follows the Node script.